
On average, enterprise merchants, eCommerce companies and retailers use four or more payment processors or payment gateways to help in processing their payments. For global merchants or businesses with international aspirations, this number of payment service providers (PSP) is definitely needed in order to ensure high authorization rates, business continuity and an overall smooth customer experience when handling a large transaction volume.
The downside to having this many integrated PSPs is that it’s difficult to obtain a comprehensive overview of all of your transactions and how they are being processed. Without this holistic understanding, it’s likely that you’re losing money on interchange fees, assessment fees and other processor fees, as your payments aren’t being optimally spread across all of your different payment processors, getting you the best rates possible at the best time. And with payment processing fees ranging between 1.5% and 3.5%, getting the best rates can make or break your business’s profitability goals.
With a unified payment analytics solution, which brings all of your data from multiple PSPs together in one place for real analysis, you will be able to make data-driven decisions to effectively manage transactions across all of your PSPs, lowering costs in the process.
In this article, we will explain what payment analytics is, how unified payment analytics can be used to optimize payment processing costs, how you can manually unify data from multiple sources and we will offer a simplified solution to unifying your payment processing data.
In this article:
What is payment analytics?
How to use payment analytics to optimize costs
How to manually unify data from multiple data sources
How to unify data from multiple PSPs with Payrails
Payment analytics vs. unified payment analytics
Payment analytics refers to the process of analyzing your business’s transaction data. This includes looking at successful payments, failed payments, refunds, chargebacks and relevant other metrics. If you’re a global merchant, payment analytics involves examining data from all of your payment processors and payment gateways for insights that will help you make data-driven decisions.
Unified payment analytics includes all of the above, however the key difference is that payment data from all of your payment processors and service providers is unified in one central place. A unified system also allows you to connect other types of data, like from an app or specific verticals, to build a holistic view of your business’s performance.
Unifying data from all of your payment processors and gateway is critical in order to get a comprehensive overview of all of your payment data. Just looking at data from one or two PSPs, like just from Checkout.com or Adyen, or looking at all of them separately and not finding any commonalities and trends, will not give you a full picture and will therefore not provide any valuable insights for your payment strategy.
So, when thinking payment analytics, it’s critical to think unified payment analytics. Analyzing data separately and without linking it to other business-critical data doesn’t make much sense.
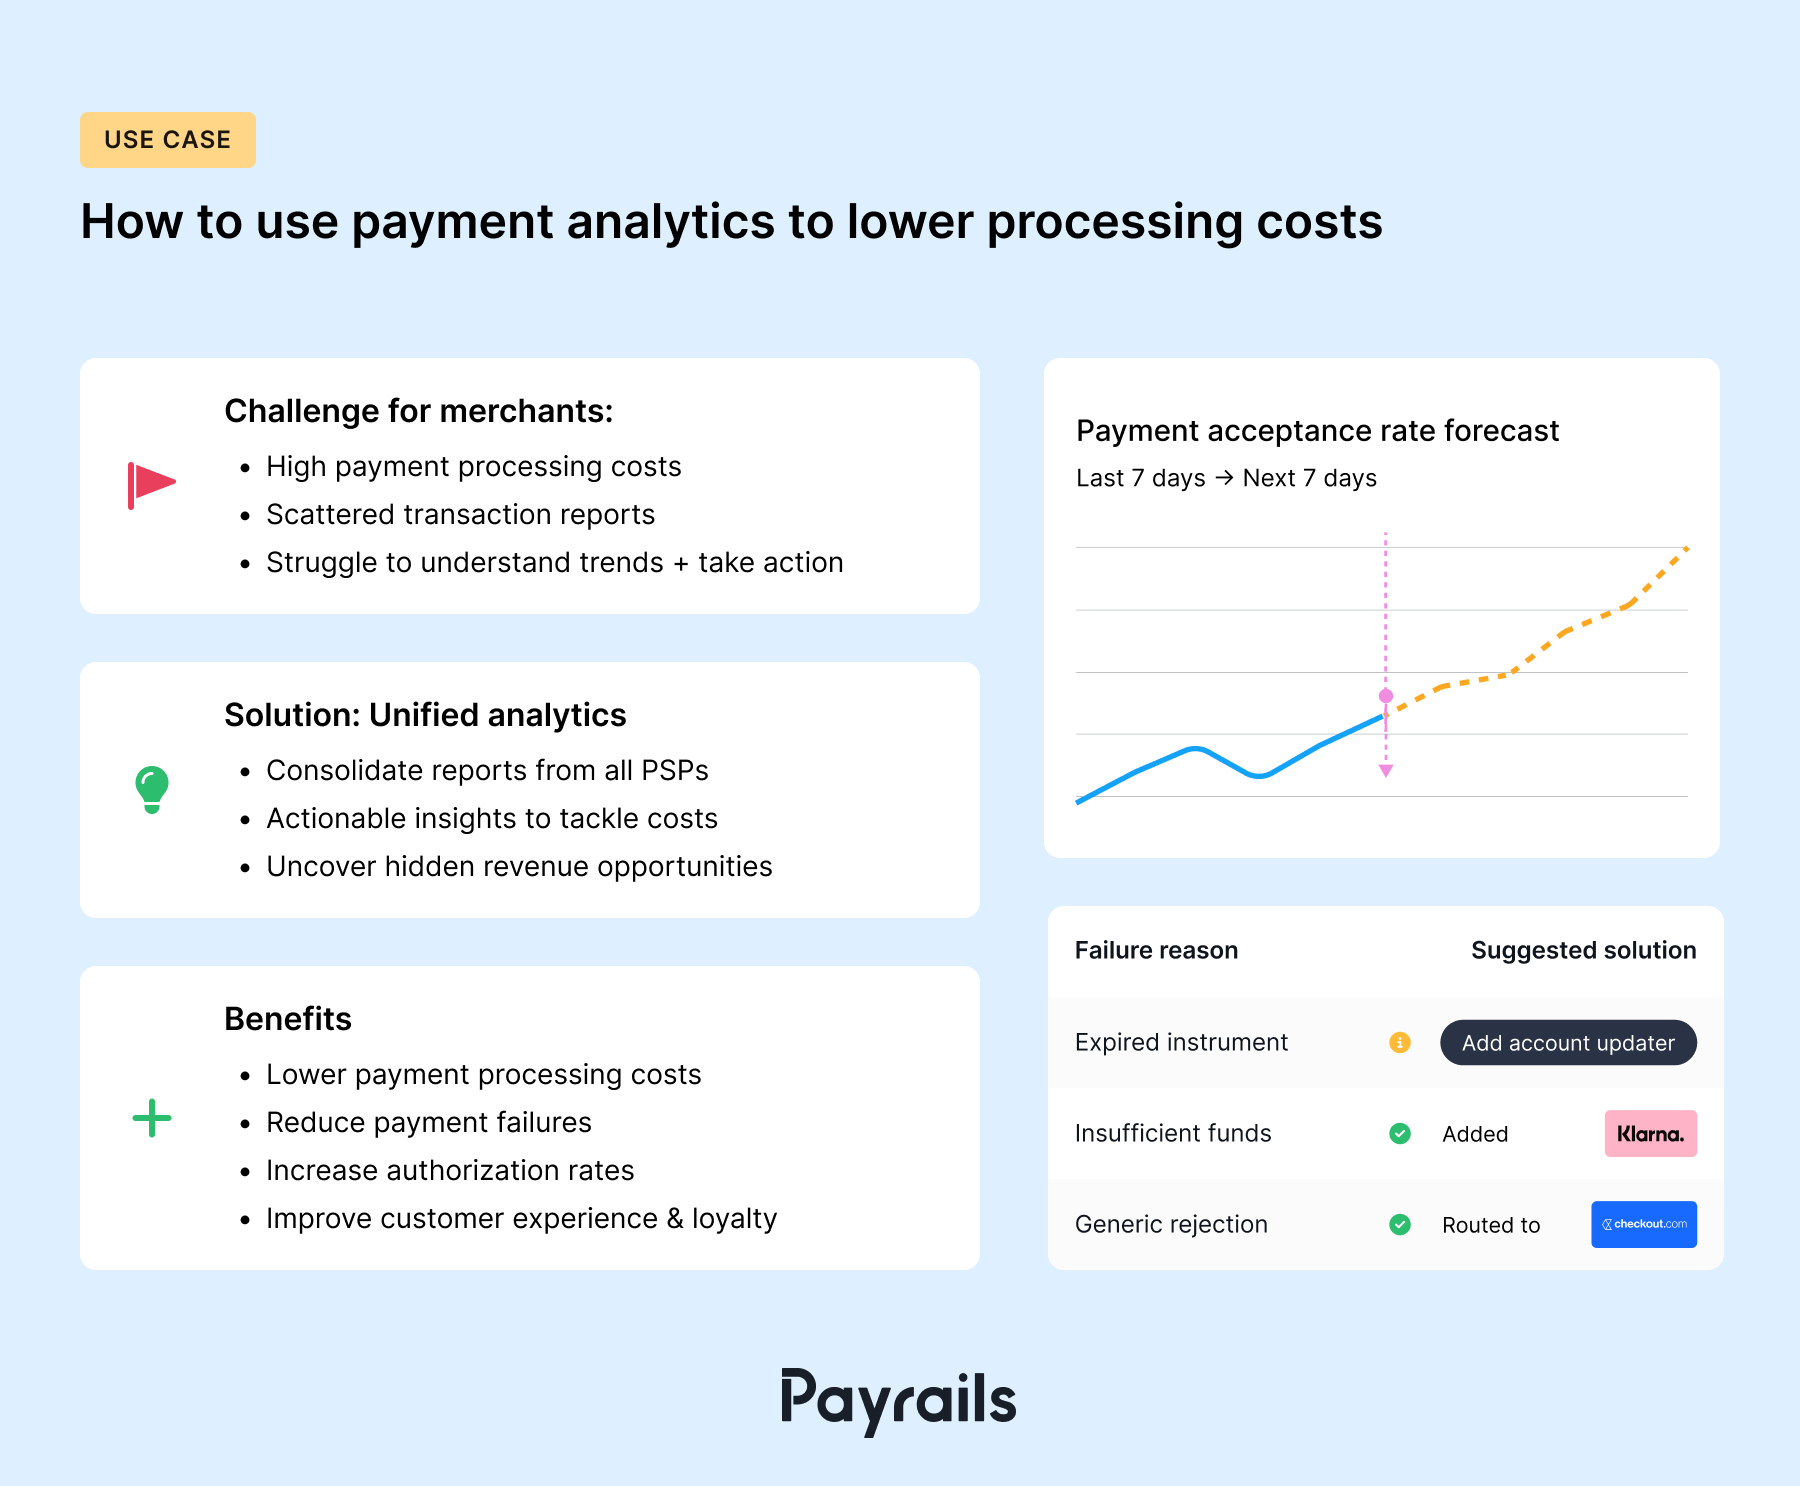
How to use unified payment analytics to optimize costs
Now that you understand the importance of unifying your payment data from multiple PSPs, it’s time to understand how exactly you can use unified payment analytics to optimize payment processing and other costs.
Simply put, the best way to improve your future is to learn from your past. And unified payment analytics offers one of the best opportunities to learn from your payment history and to make smart decisions to lower costs, use your payment service providers to the fullest and improve other key metrics, like payment authorization rate and customer satisfaction.
Reduce processing fees by leveraging multiple processors
One way of reducing fees is by comparing all of your current service providers and the transactions completed with each processor. Closely analyze the costs related to each transaction, like the processing fees, markup fees, refund fees or chargeback fees. Payment processors usually offer reports that you can download from your account – more on that below. By diving deep into the data and comparing the types of transactions and how much they cost, you will be able optimize your payment routing so that transactions always go to the processor with the most favorable conditions at the time of purchase.
For example: Let’s say Adyen has a flat rate processing fee of €0.11 plus a fee that is based on the payment method used. Stripe, on the other hand, might calculate a fee of 1.5% plus an additional €0.25 for cards based in the EEA. Depending on a variety of factors, including where the transaction takes place, what payment method is used, the transaction type, the transaction volume and the card network, the end price per transaction might vary wildly from transaction to transaction.
Equipped with a detailed analytics report that combines data from all of your processors, you will be able to split payment traffic across your PSPs in a way that saves you money in the long run. For instance, you could determine that transactions with a certain payment method, like credit card transactions, only go to a certain processor because they offer the best fee conditions for credit card processing. Or that you choose a local processor in certain markets because they offer more competitive pricing.
Increase authorization rates
A unified view of your payment analytics also provides insights into your payment authorization rate, a metric which will reveal not only how many transactions are successfully processed, but also which processor authorizes the most transactions and for what price.
Ideally, you will want to route your payments in a way to get the most authorizations possible. However, when working with multiple payment processors, be sure to weigh the fee rate against the authorization rate. Is it worth getting a higher authorization rate if it means the fees are also higher? Although a slightly higher authorization rate can offset higher fees, it’s still something you will have to carefully calculate based on your transaction history and business goals.
Achieving the right balance is crucial. The ideal scenario, as depicted in the matrix below, is to maintain a high authorization rate while keeping the fee rate low. High authorization rates typically increase the likelihood of successful transactions, but this can come at the cost of higher fees. Conversely, lower fees may result in a reduced authorization rate. The goal is to find a sweet spot where the authorization rate is maximized without incurring prohibitive fees. This will optimize your overall revenue, customer satisfaction and business growth.
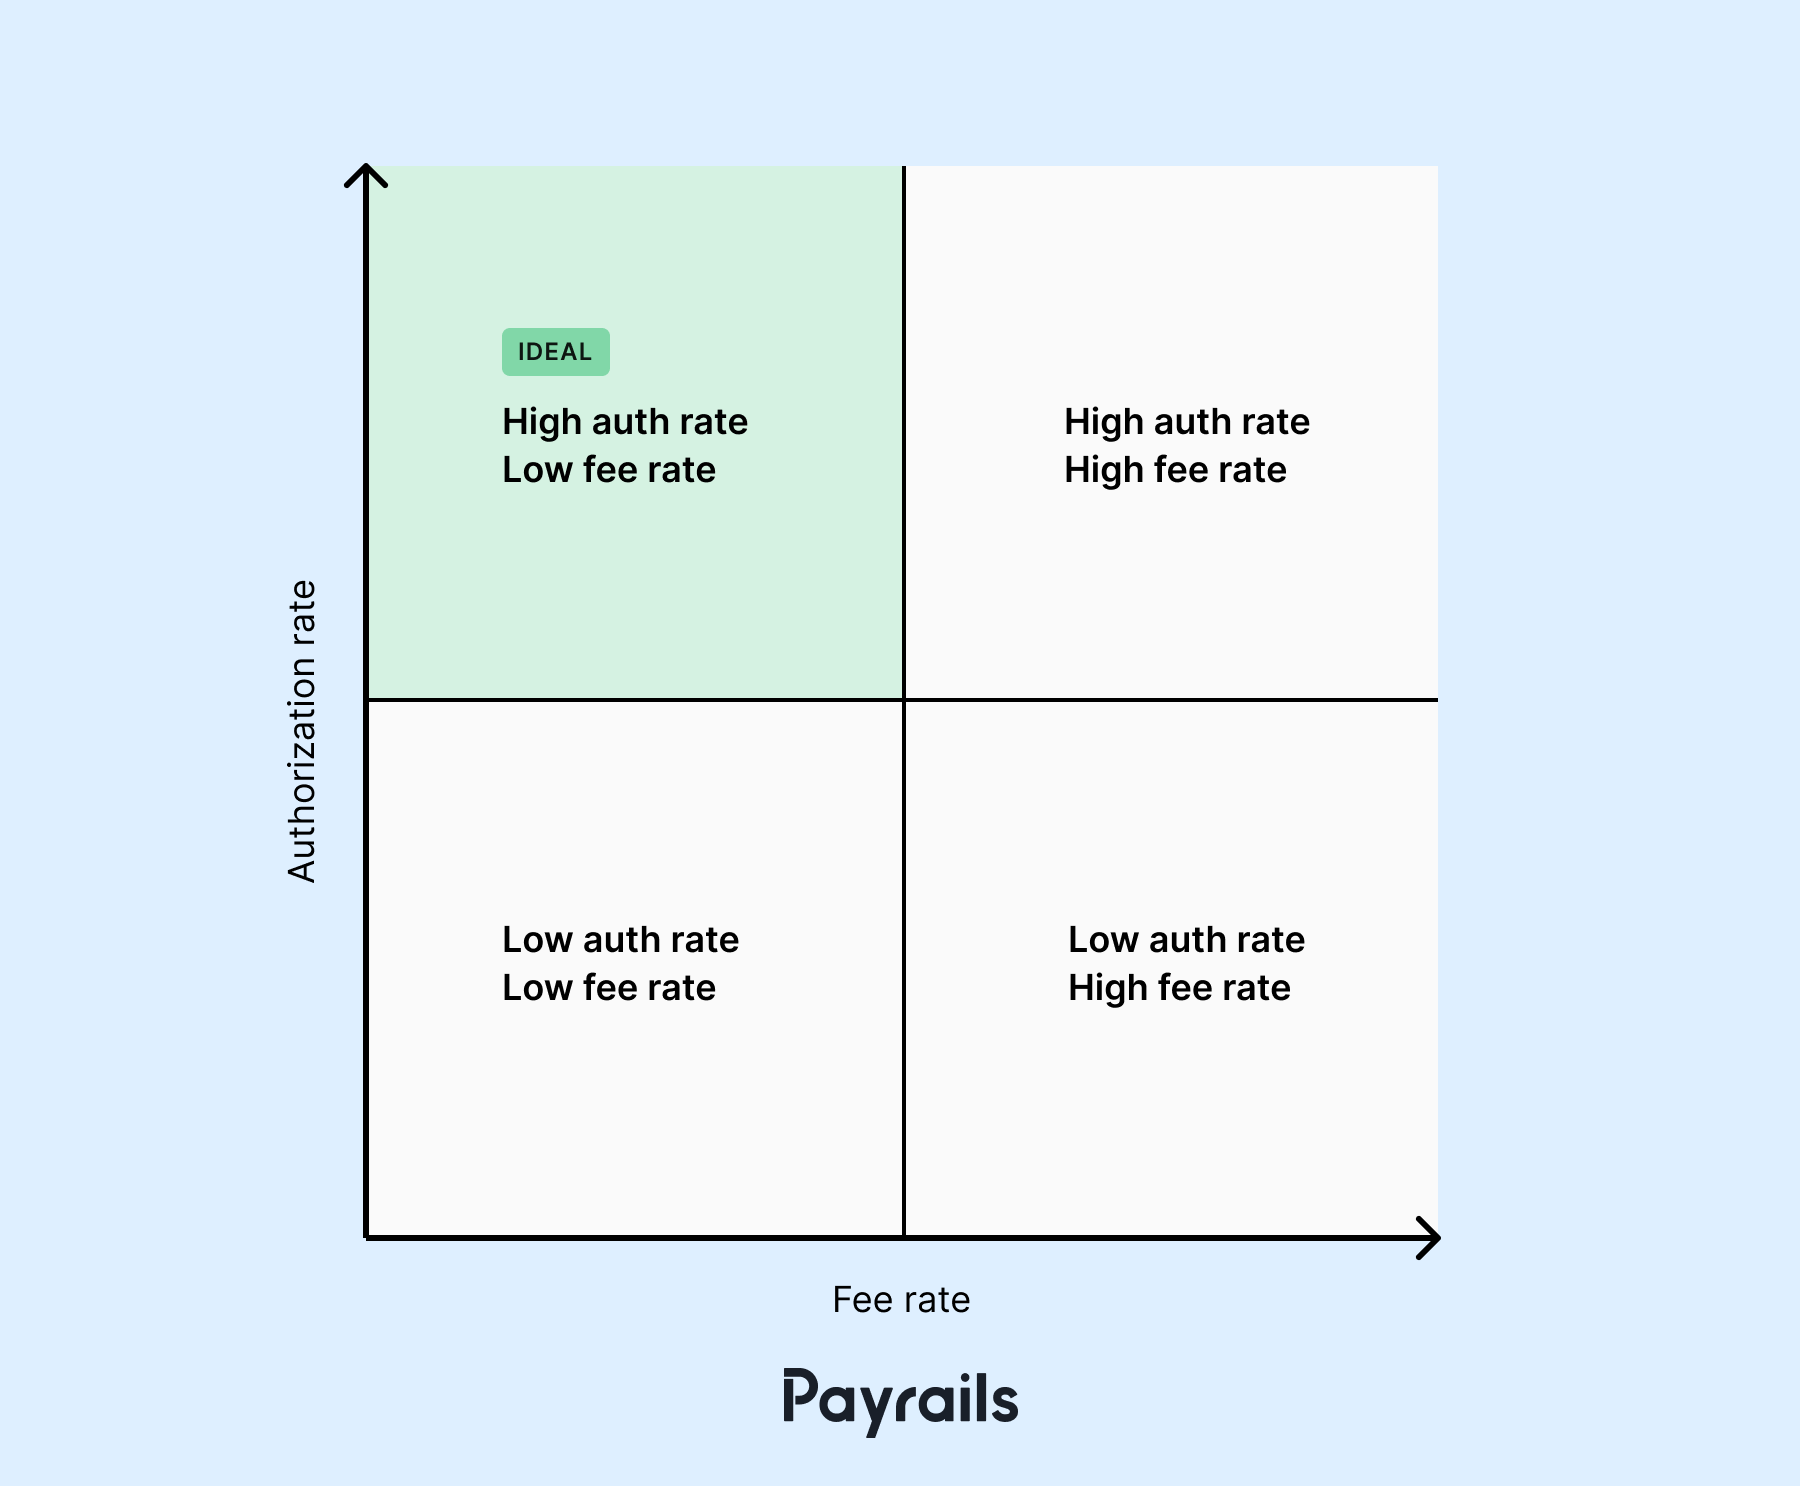
Unified analytics reports will empower you to evaluate your PSP data against this matrix to ensure that your business remains in the ideal quadrant. This way, you will be able to maximize your potential payment authorization rate while keeping processing costs low.
Reduce payment failures
Similarly to understanding the conditions of payment success, unified payment analytics can provide you with detailed information into payment failures. An Accuity study revealed that 60% of organizations reported losing customers as a result of failed payments, and that the total cost of failed payments regionally was $41.1 billion in EMEA, $33.7 billion in the Americas and $43.7 billion in APAC.
Payment failures can add up and interfere with your business’s profitability targets. By understanding why your payments are failing, you will be better equipped to address the exact issue or issues.
By evaluating your payment analytics, you will be able to gauge which processors, payment methods or other factors have the most payment failures over time (a single payment failure here or there is normal – it’s when it becomes a trend that you should really pay attention). With this knowledge, you will be able to set up routing rules that mitigate these reasons for payment failures.
Improve customer loyalty
Another way that unified payment analytics can help you reduce costs is by helping you to create a seamless customer experience that will improve customer satisfaction and therefore loyalty in the long term.
An average taken from recent studies on reasons for cart abandonment has shown that 11% of shoppers abandon carts because there weren’t enough payment methods or their preferred payment method wasn’t included in the options. By unifying your data from all of your payment processors, you will be able to see which payment methods are preferred and under which conditions. This means that certain regions and countries have payment methods that they prefer to use, and in order to serve your customers in that market better, you should offer those exact payment methods.
Whether it’s iDeal in the Netherlands or Pix in Brazil, do some research and dive into your data reports to find the payment methods that have led to the highest payment authorization rates. This will lead to fewer cart abandonments as customers will always have the payment method they are looking for.
So now that you understand the benefits of unifying data from multiple sources in order to analyze it effectively, we will walk you through two methods for unifying your payment data from multiple sources. The first is the manual approach and the second is the automated approach.
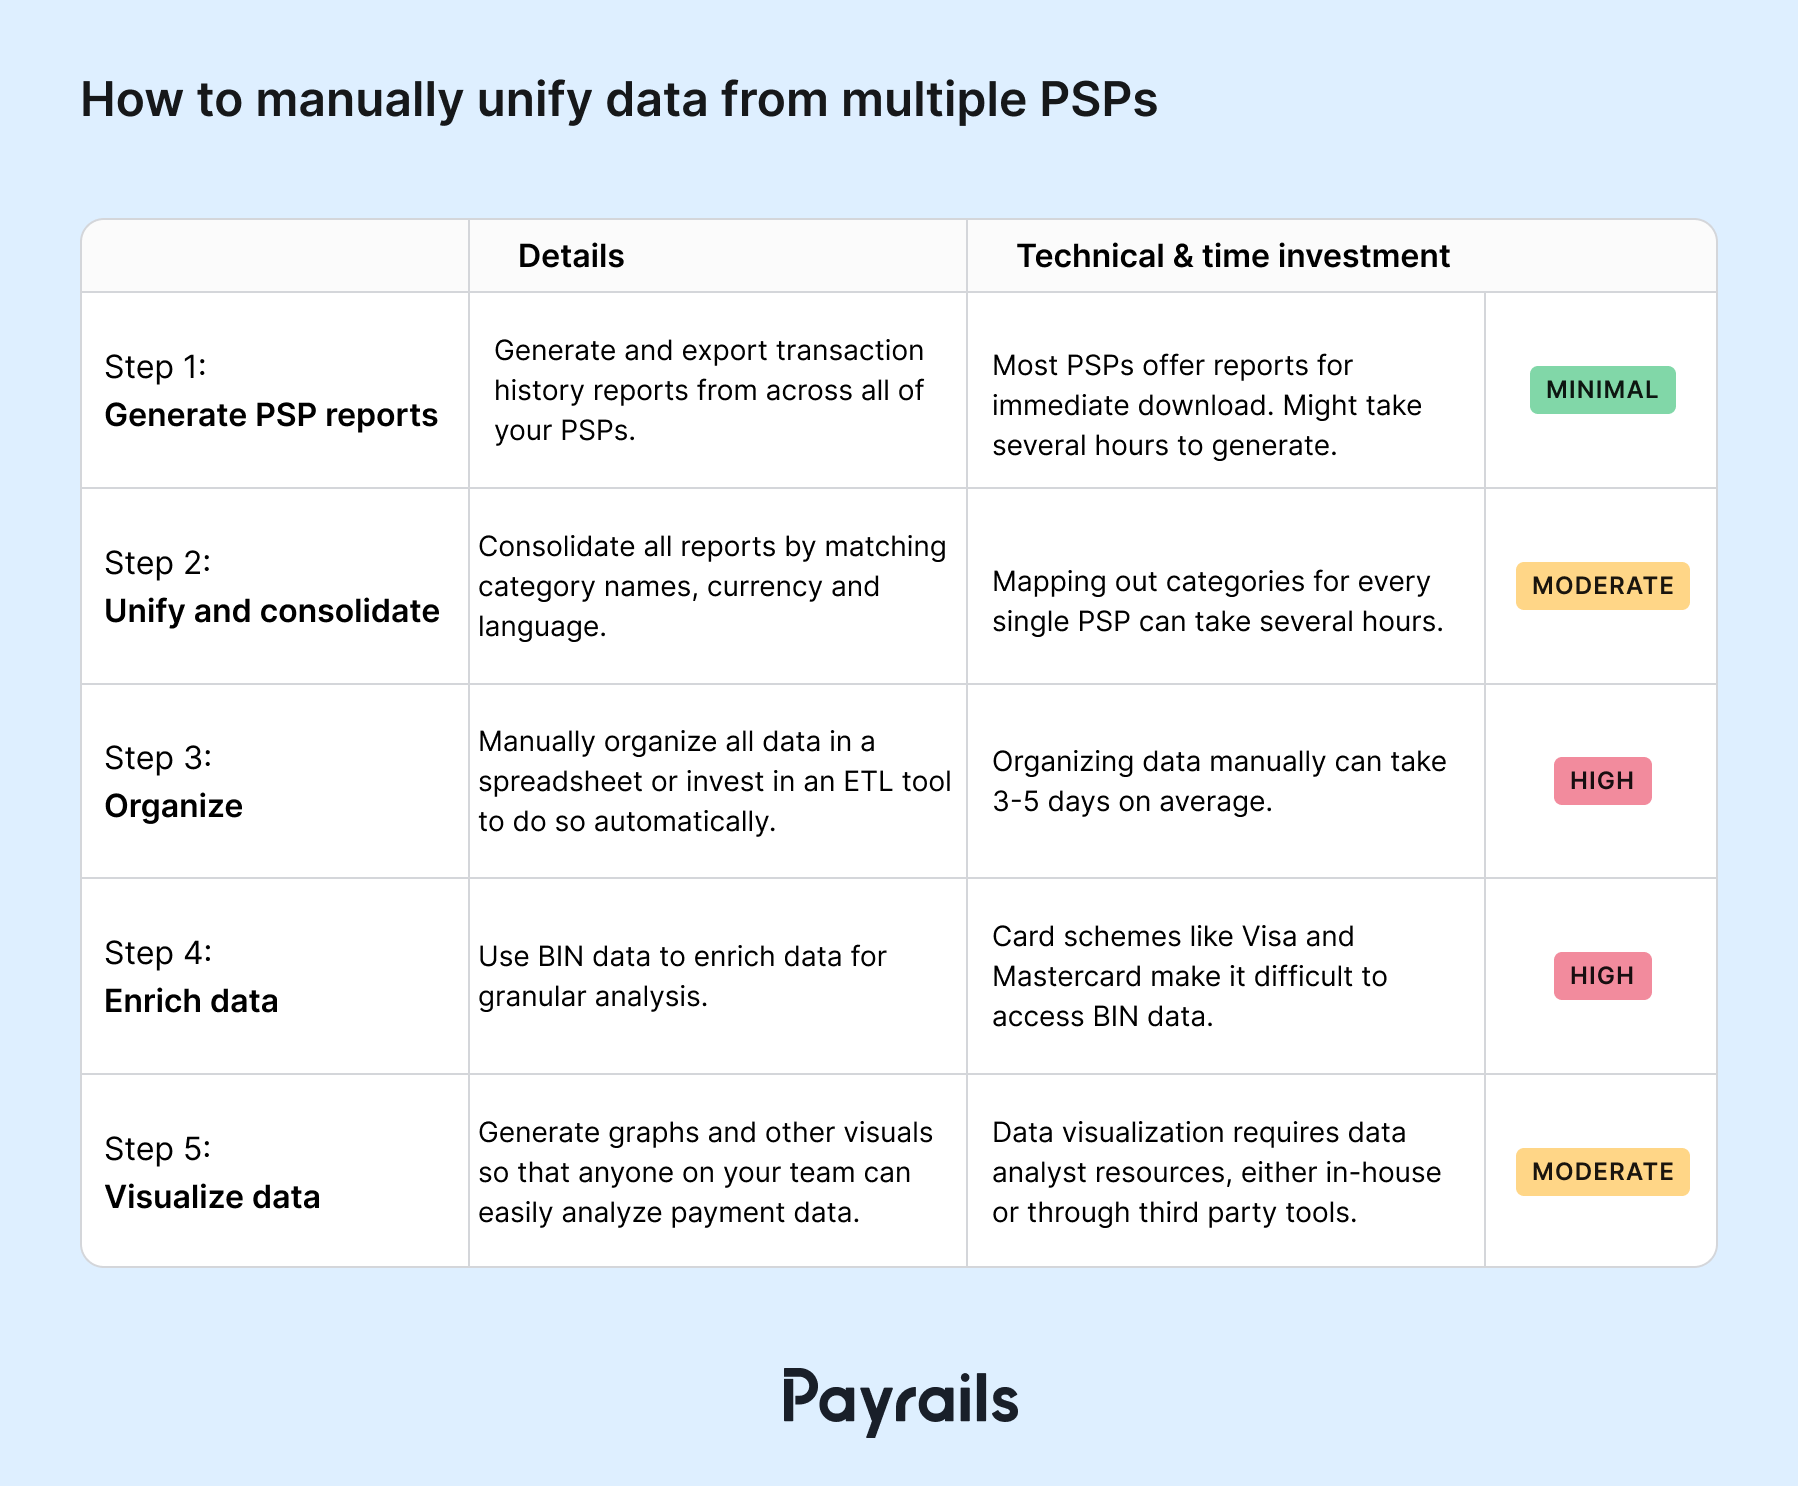
How to manually unify data from multiple data sources
One do-it-yourself way of unifying data from multiple sources is to manually generate reports from all of your payment service providers, match the data fields across all exports, visualize the data and then start with your analysis. Below is a step-by-step guide on how to do just that.
1. Generate and export reports from all of your PSPs
The first step in this process involves logging into all of your payment service provider accounts separately and locating where you can download a report of all your transaction data.
Each provider has a different set-up. Stripe, for instance, offers the possibility to download a Balance history, which includes individual payments, refunds and disputes. They also offer Revenue Recognition reports, which you can download as .CSV files. Generated in the Stripe dashboard, these reports include information on revenue and deferred revenue.
If you use Adyen, you can generate and download a Merchant Report for specific data ranges as well as in various file types. You can generate these reports manually as you need them or set up automatic reporting to your Adyen account based on a schedule that works for you. Adyen notes that generating these reports can take several hours, especially for merchants with high transaction volumes.
Checkout.com offers a variety of reports that each tackle a different metric. This includes balance reports, payout reports, settlement statements and financial action reports. You can access these reports via Secure File Transfer Protocol (SFTP) or via API.
Ideally these reports should go into great detail on total fees and fees per transaction. They should also include fields that can easily be filtered for better understanding, like a transaction ID, which will enable you to align this data with your own internal records.
2. Unify and consolidate your reports
Next, in order to truly understand your fee situation, you must consolidate the various reports that you have just generated from your payment partners. This can be a tedious task, as there are often great variations in fields, values and currencies.
Consider this: When a refund of payment happens, Checkout.com classifies it as “Refund” while Stripe calls it “payment_refund”. This might not seem like a big difference, however you will have to account for these differences in naming conventions when consolidating all of your data into one single spreadsheet.
One way to anticipate this before you consolidate your separate reports is to get familiar with how each processor classifies and breaks down each aspect of a transaction. Using their guides – for Checkout.com and for Stripe, as just two examples – map out which category matches with which and already create a master sheet where you can later copy and paste the information from each report.
Additionally, you might want to already consider other complexities that come with the consolidation task. If you use local processors, they might only provide settlement files in their local language, making the kind of standardization outlined above more difficult. In order to translate reports, you will either need to engage internal resources or hire local payment consultants.
Lastly, keep in mind that generating and unifying your reports manually is not a one and done type of deal. It will have to be repeated every time you want to get insights into your transaction history in the future.
3. Manual organization or ETL development
Once you have generated all of your reports and accounted for the discrepancies in classification and naming conventions, it’s time to bring all the data together into one place. Either you can organize all of the reports in one large, master spreadsheet, or you can invest in buying or building an extract, transform and load (ETL) solution.
Spreadsheets
In order to attain a holistic view via spreadsheets, you will need to merge them together one by one. Depending on the number of processors you use, this can be an incredibly time-consuming task, not to mention it could eat up resources and energy that can be better used elsewhere. One survey found that data consolidation can take three to five days per month. This is due to the increased demand for granular data, which is indeed essential for making any kind of valuable assessments about your business.
Using spreadsheets can also typically be an error-prone process since it relies entirely on manual input. So it might require extra vigilance or planned time to review and check for any data that was inputted incorrectly.
ETL solution
As an alternative to manually consolidating data in a spreadsheet, you could turn to a so-called extract, transform and load (ETL) solution. It’s possible to build such a solution in-house, however it requires substantial data engineering expertise and resources.
There are a variety of ETL software solutions on the market, like Integrate.io, IBM DataStage, Whatagraph and Oracle Data Integrator, just to name a few. They are designed to extract data from multiple sources and bring it all together in one place. Though most offer a free trial period, these solutions can cost several hundred dollars a month, either through fixed pricing or based on data volume, which can be on the high end if you’re an enterprise business.
There are also free open source ETL solutions like Singer or Hadoop. Though they are free, there are drawbacks to open source software you need to consider. Open source solutions are often not very user friendly and require a steep learning curve without support from a dedicated team. There are also security concerns, since open source is open to be edited and modified by anyone. You don’t want to leave your data vulnerable to misuse.
Other things to consider
Adding to this complexity, some acquirers, particularly in emerging countries, still provide settlement details in a PDF format, often shared via email. This not only complicates the extraction of data but also presents challenges when these documents are in different languages, requiring additional steps for translation. This makes manually managing multiple spreadsheets even more difficult and extremely time consuming.
4. Enriching data for granular analysis
To thoroughly analyze fees, it's crucial to enrich your data with BIN-related information. This includes details like networks, card types, geographical locations, and issuing banks, as well as the relationship between incurred fees and their corresponding transaction.
Why is this important? This level of detail enables a more precise dissection of fees. And with greater detail comes greater understanding of fees, which can lead to more informed decisions and in turn more revenue opportunities.
Additionally, tracking the cost performance of on-us transactions (where the issuing and acquiring banks are the same) is essential. Consider a scenario where you're analyzing BINs that have the highest transaction counts. By adjusting the routing, you could convert some of these transactions into on-us transactions for specific BINs and enjoy substantial savings for interchange and scheme fees.
5. Visualizing the consolidated data
Finally, once all your data from multiple PSPs has been unified and enriched, it is time to visualize the consolidated information in order to draw smart conclusions. Any graphs and visuals based on the data should be intuitive and easy to understand, and there are a variety of ways you can visualize your data in order to allow all team members to make informed decisions, regardless of their expertise in payments.
If you don’t want to use up internal resources to visualize your data, you can also pay for a third party tool that takes care of this process.
Google’s Looker Studio, formerly Google Data Studio, converts data into customizable dashboards and charts and is free to use for creators and report viewers, however enterprise customers should upgrade to the Pro version in order to handle their data volume. Microsoft has its own software called PowerBI which costs $20 a month per user. A popular choice is Tableau, which can import data from a variety of sources, including CSV files and Salesforce data, and can generate charts and maps. Although there is a free version, the paid version costs $70 a month per user. The price range for similar tools ranges from $20 to $70 a month per user.
As with the ETL tools, there are open source data visualization tools on the market, like D3.js. However these require technical knowledge to get started and to maintain.
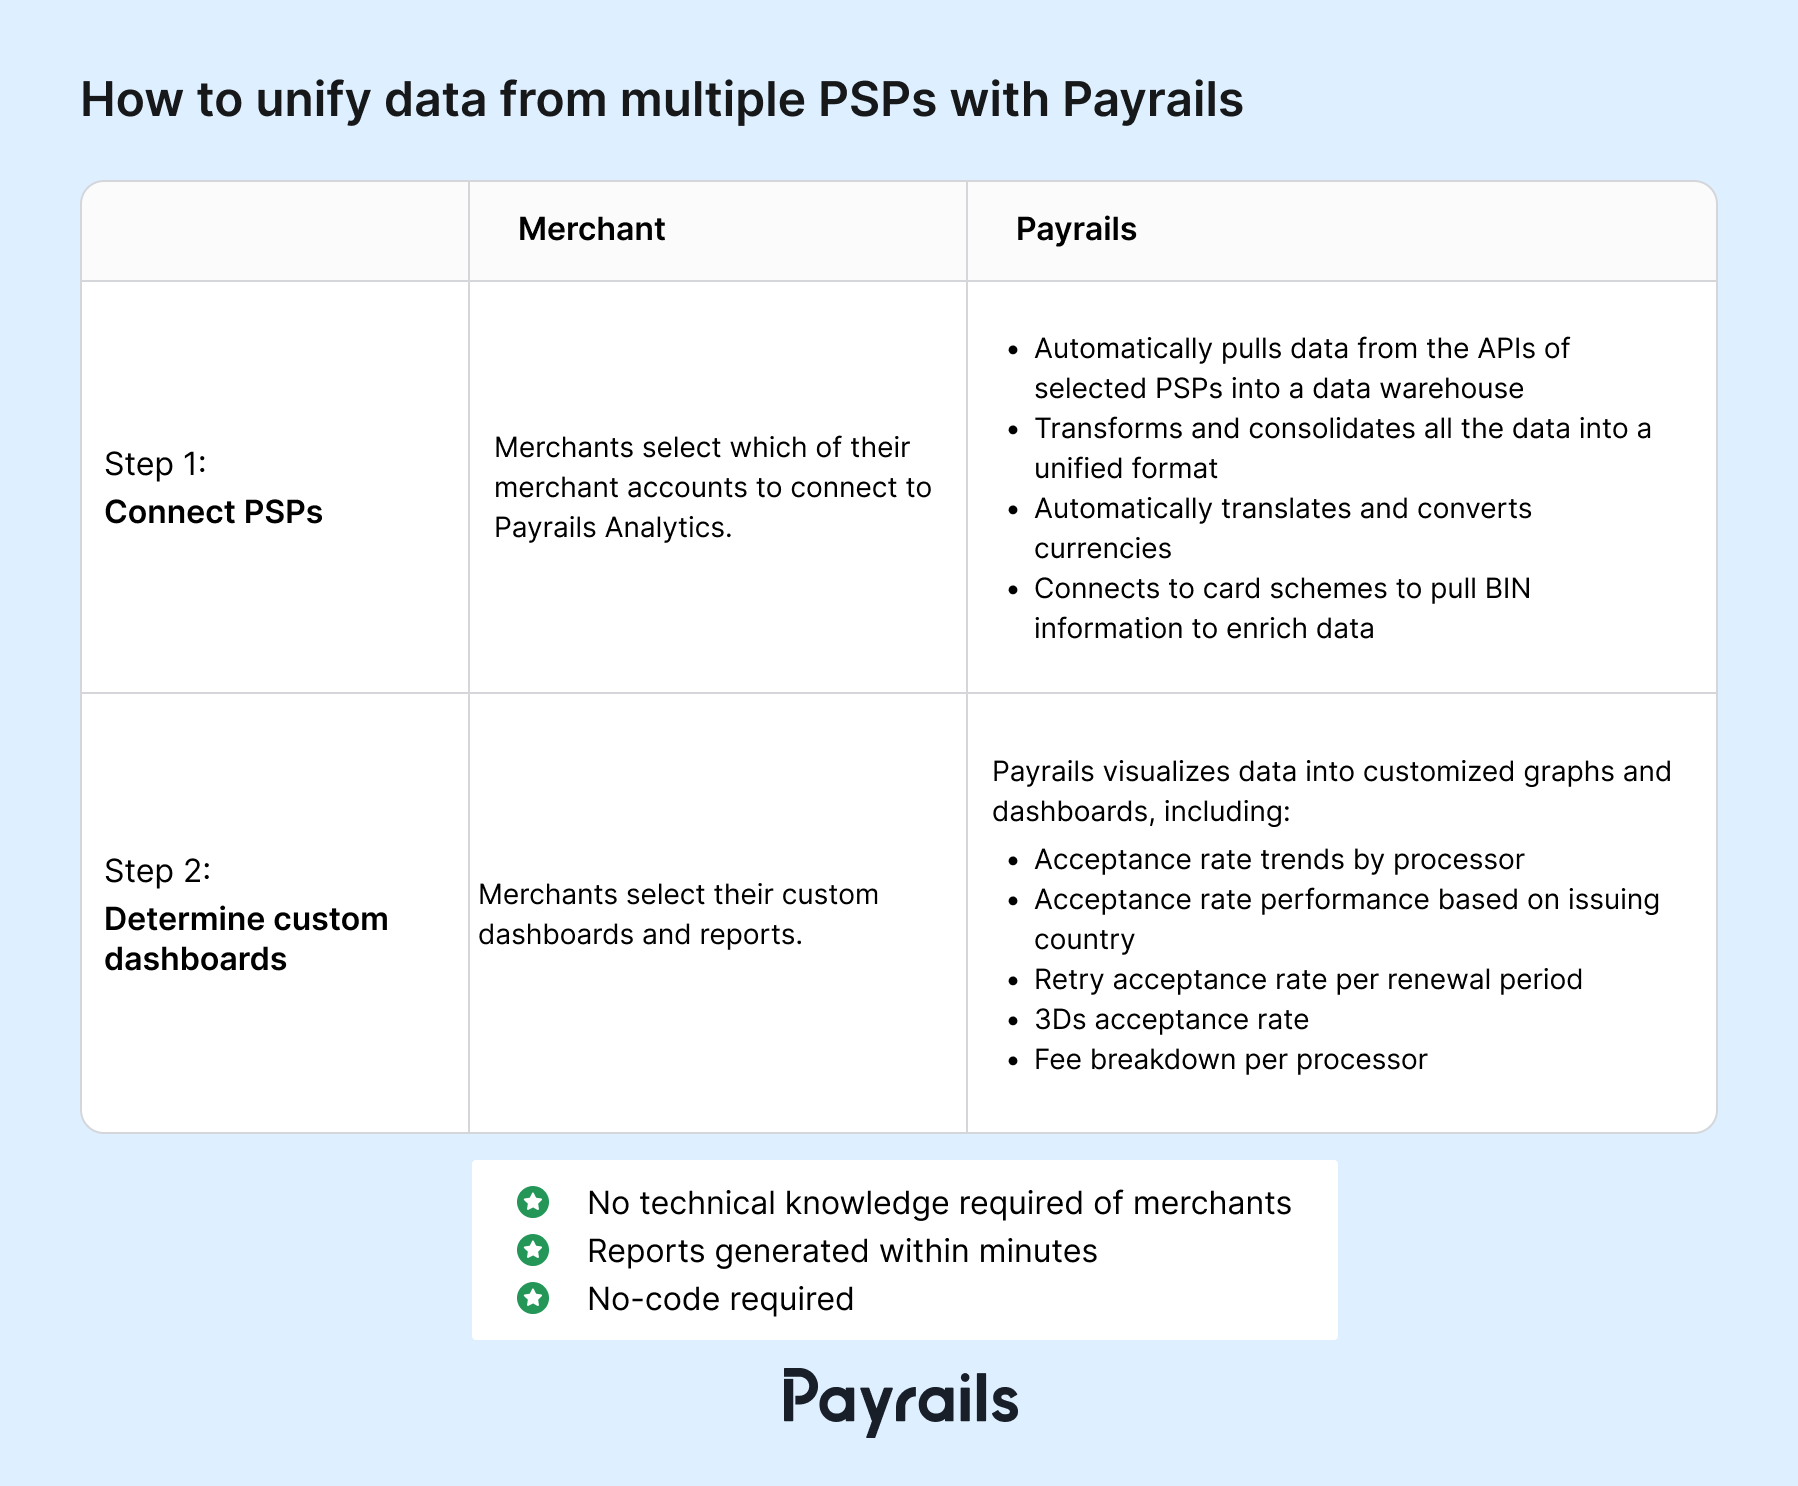
How to unify data from multiple PSPs with Payrails
At Payrails, we eliminate the need to manually compile transaction fee reports from multiple payment service providers and payment methods. We’ve streamlined this complex process by creating a tool that allows you to generate ready-to-read fee structure reports with data from all of your payment processors and gateways, eliminating the need for any technical investment on your part.
Here’s how Payrails Analytics works:
Payrails automatically pulls data from the APIs of multiple global and local PSPs into a data warehouse, transforms and consolidates all the data into a unified format. Payrails visualizes the unified data in various dashboards and charts so that merchants can view all their payment data in a single view and compare performances of PSPs.
30+ different metrics are automatically visualized so that anyone in your team can learn from them. The charts include:
- Acceptance rate trends by processor
- Acceptance rate performance based on issuing country
- Retry acceptance rate per renewal period
- 3Ds acceptance rate
- Fee breakdown per processor
Payrails also takes care of currency conversion and translation so that merchants don’t have to outsource this process separately. We automatically convert the currencies in your PSP reports to your chosen default currency.
To enrich your data, Payrails also connects to card schemes like Mastercard and Visa to access the most accurate BIN data so that granular analysis of your data reports.
Lower your processing costs and more with Payrails Unified Analytics
Payrails Analytics is the first step on your journey towards cost optimization. As you learn from the unified data how your processing costs add up between PSPs, you can make rules to route your payments across processors with the lowest costs per transaction, region or whichever factors make sense for your business.
Saves time, money and resources
Payrails Analytics eliminates the need for any technical knowledge as well as manual effort. Focus your time and resources on other parts of your business while Payrails Analytics does the heavy lifting, consolidating scattered data and visualizing it for easy digestion.
Provides actionable insights
Our analytics platform provides you with an in-depth look at all of your transactions and related fees in one central location. With intelligent, automatically suggested insights, you can act on critical opportunities to lower your processing fees by understanding your fee structure and transaction history across all of your service providers.
Uncover revenue opportunities
Aside from learning where you can optimize your payment processing costs, the data reports in Payrails Analytics can also unveil hidden revenue opportunities. These usually take the form of little tweaks you can make here and there to ensure the maximum amount of payment authorizations.
.png)
Unify your payment data with Payrails Analytics
Our clients have already enjoyed substantial savings by decoding the complexities of fee structures thanks to our analytics platform, including a 30% decrease in processing fees as well as a 15% growth in acceptance rates. Our unified analytics platform has also significantly reduced the amount of manual work that merchants have to put into managing their data reports as everything is automated.
As payment experts, we excel in assisting companies that operate globally and that work with multiple PSPs. Our analytics dashboards go beyond mere consolidation of fee reports: they transform data into actionable insights, pinpointing exact opportunities for fee optimization at the most granular level.
Get in touch with us today and discover how you can optimize your payment costs through a personal consultation.

I am the text that will be copied.